S&P500 Daily Action Areas & Price Targets 9/11/26

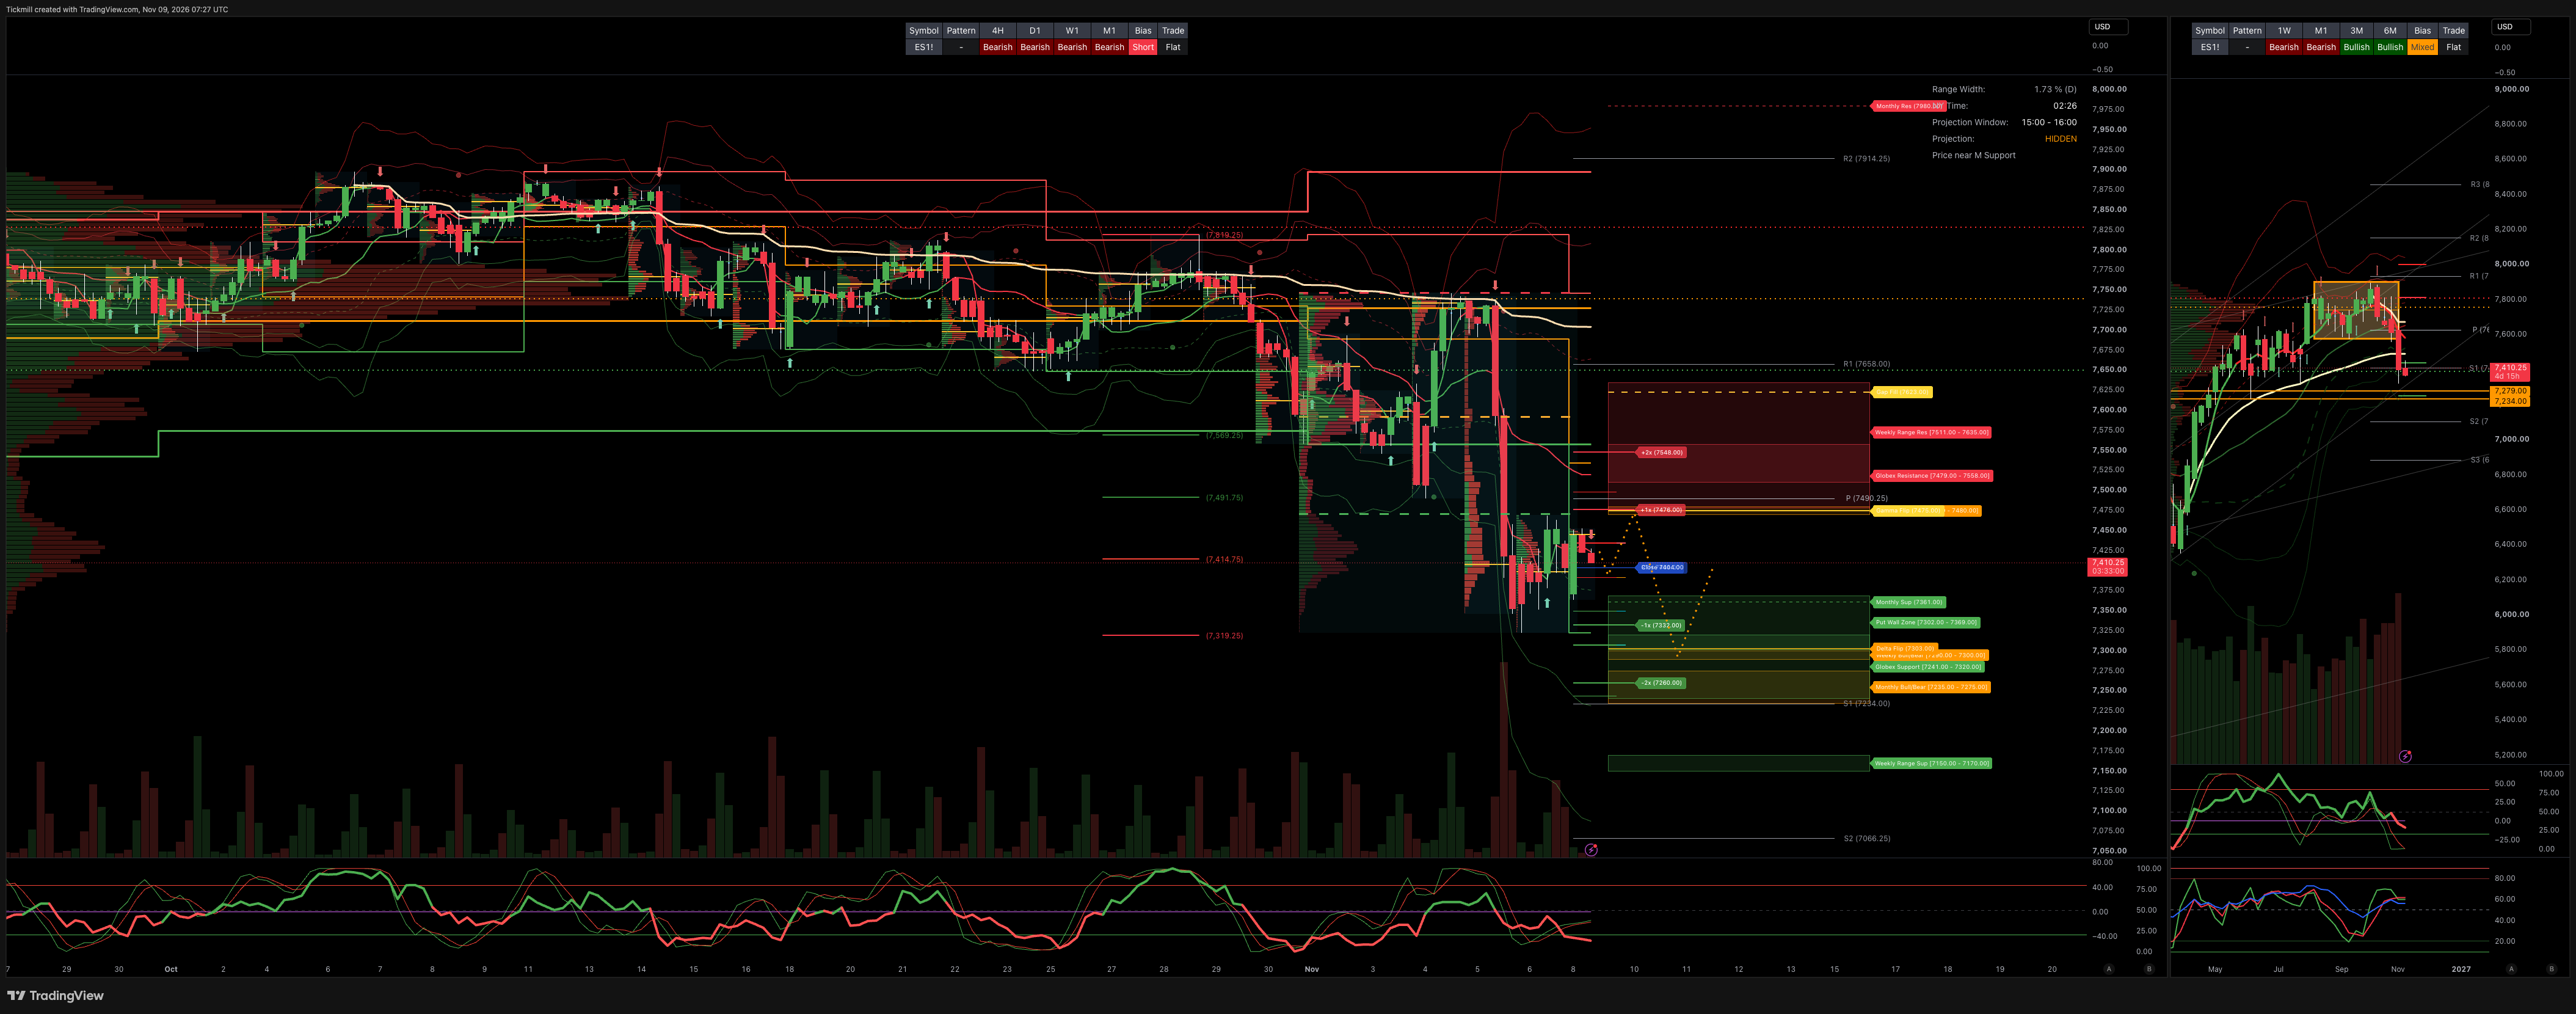
S&P500 Daily Action Areas & Price Targets 9/11/26
***QUOTING ES1!(Z CONTRACT LEVLES) FOR CASH US500 EQUIVALENT LEVELS, SUBTRACT POINT DIFFERENCE***
MONTHLY-WEEKLY& DAILY LEVELS
MONTHLY BULL BEAR ZONE 7275/35
MONTHLY RANGE RES 7980 SUP 7361
WEEKLY BULL BEAR ZONE 7300/7290
WEEKLY RANGE RES 763/511 SUP 7170/50
DAILY BULL BEAR ZONE 7470/80
GLOBEX RANGE SUP 7320/7241 RES 7479/7558
GAMMA FLIP 7475
DELTA FLIP 7303
CALL WALLS
PUT WALLS 7369/02
DAILY STRUCTURE - OTFL - 7712
WEEKLY STRUCTURE - OTFL - 7469
MONTHLY STRUCTURE - OTFL - 7746
VIX BULL BEAR ZONE 18.72
VVIX-to-VIX ratio, currently hovering at approximately 4.76, comfortably falls within the historically typical range of 4.0 to 6.0. This suggests that volatility expectations are in a neutral zone, reflecting neither panic nor extreme contrarian sentiments.
PRIMARY TRADES & TARGETS
SHORT ON REJECT/RECLAIM DBBZ TARGET RTH CLOSE>WBBZ
LONG ON REJECT/RECLAIM WBBZ TARGET RTH CLOSE>DBBZ
***ADDITIONAL SETUPS & TARGETS HIGHLIGHTED ON THE CHARTS***
(I FADE TESTS OF 2 SIGMA LEVELS ESPECIALLY INTO THE FINAL HOUR OF THE NY CASH SESSION AS 90% OF THE TIME WHEN TESTED THE MARKET WILL CLOSE ABOVE OR BELOW THESE LEVELS)
SPX PUT/CALL RATIO 1.21 (The numbers reflect options traded during the current session.) A put-call ratio below 0.7 is generally considered bullish, and a put-call ratio above 1.0 is generally considered bearish.
JHEQX Upside cap (~7,920–7,950): Dealer gamma hedging at this call strike creates resistance, with market makers likely selling futures into strength and limiting volatility. Downside cushion (~7,270): If SPX drops 5% into Q4, long put gamma may force dealers to buy futures as the index falls, helping stabilize prices. Expiration: December 31, 2026. Strong pinning effects are likely near key strikes into year-end expiration.
DEC2025 OPEX to DEC2026 OPEX is 945 points giving us a range of [5889,7779]
Notes On Structure Implications
Balance: This refers to a market condition where prices move within a defined range, reflecting uncertainty as participants await further market-generated information. Our approach to balance includes favouring fade trades at the range extremes (highs/lows) while preparing for potential breakout scenarios if the balance shifts.
One-Time Framing Higher (OTFH): This represents a market trend where each successive bar forms a higher low, signalling a strong and consistent upward movement.
One-Time Framing Lower (OTFL): This describes a market trend where each successive bar forms a lower high, indicating a pronounced and steady downward movement.
GOLDMAN SACHS FICC & EQUITY TRADING DESK VIEWS
THE TAKE: SEMI RELIEF STABILIZES TAPE AS NET LEVERAGE HITS 0TH PERCENTILE 5-YEAR
Following Thursday's violent liquidation, US equities mounted a stabilizing recovery session into the weekend, led by a ~3.5% rebound across Semiconductors. Desk observation highlighted the move as fundamentally healthier than a mechanical short squeeze: Long-Only TMT tickets finished balanced, with lingering pockets of semi supply increasingly absorbed by fresh green shoots of selective demand—a sharp contrast to Thursday's unhedged selling across all AI exposures.
Beneath the surface, however, Prime Brokerage data reveals an acute de-leveraging event:
Historic Weekly De-Grossing: US Fundamental Long/Short Gross Leverage dropped -8.7 percentage points to 207.5% (26th percentile 1-year)—marking the largest single-week gross leverage collapse since the March 2020 COVID shock.
Net Leverage Hits 5-Year Floor: Net leverage fell -3.7 percentage points to 43.3%, printing at the absolute 0th percentile over a 5-year lookback.
Record Global Tech Liquidity Drain: Information Technology was by a wide margin the most dollar net-sold sector globally and domestically. Dollar net selling in global tech stocks ranked on par with the largest net-selling weeks in desk history (since 2016). Remarkably, 4 of the top 5 net-selling weeks in global Info Tech on record have occurred within the last 5 months.
Top-down macro instruments continued to dominate trading activity, with index and sector ETFs surging to 37% of total exchange volume (vs. the 28% YTD average). Hedge funds finished as net buyers on the day via broad cover bids across sectors and macro products, though high-touch activity remained subdued as desks paused to evaluate positioning ahead of next week's inflation reports.
PRIME BROKERAGE RISK & POSITIONING METRICS (AS OF COB NOV 5)
US Fundamental L/S Gross Leverage: 207.5% (-8.7 pts 1-week; 26th percentile 1-year). The steepest risk-cutting episode since March 2020.
US Fundamental L/S Net Leverage: 43.3% (-3.7 pts 1-week; 0th percentile 5-year). Systematic and discretionary books have fully liquidated marginal beta.
Flow Decomposition: Modest net selling across US equities for the full week was driven by the largest single-stock net selling in 4 months, offset by tactical cover bids and long additions in Macro Products (Index & ETFs).
EXECUTION DESK FLOWS & MICROSTRUCTURE
High-Touch (HT) Tape Dynamic: Floor activity was exceptionally quiet heading into the weekend. Inbounds were dominated by sentiment-checking inquiries rather than aggressive risk commitment.
Institutional Skews:
Long-Only (LO): TMT order flow finished roughly balanced. Sizable semiconductor supply tails were matched by selective dip-buying demand.
Hedge Funds (HFs): Finished net buyers via broad-based short covering across cyclicals, defensive sectors, and macro wrappers.
ETF Market Share: ETF volume reached 37% of total market tape, underscoring that institutional asset allocators are executing macro portfolio rebalancing via wrappers rather than transacting in single-stock cash liquidity.
UPCOMING CATALYSTS & DERIVATIVES STRADDLE PRICING
The implied straddle through Friday, November 13 close is pricing a +/- 2.48% move, reflecting high-impact macro inflation data and key corporate earnings:
Macro Data Calendar:
Tuesday, Nov 10: US Consumer Price Index (CPI) for October.
Friday, Nov 13: US Producer Price Index (PPI) for October.
Corporate Earnings Releases:
Monday, Nov 9: Constellation Energy (
CEG), KKR (KKR), Occidental Petroleum (OXY), The Trade Desk (TTD), Take-Two Interactive (TTWO), CNH Industrial (CNH), Ferguson (FERG), AAON (AAON), H&R Block (HRB), Sanmina (SANM), Skyward Specialty (SKYD).Tuesday, Nov 10: CoreWeave (
CRWV).Thursday, Nov 12: Applied Materials (
AMAT), Cisco Systems (CSCO), Cambium Networks (CBRS).
Disclaimer: The material provided is for information purposes only and should not be considered as investment advice. The views, information, or opinions expressed in the text belong solely to the author, and not to the author’s employer, organization, committee or other group or individual or company.
Past performance is not indicative of future results.
High Risk Warning: CFDs are complex instruments and come with a high risk of losing money rapidly due to leverage. 68% and 74% of retail investor accounts lose money when trading CFDs with Tickmill UK Ltd and Tickmill Europe Ltd respectively. You should consider whether you understand how CFDs work and whether you can afford to take the high risk of losing your money.
Futures and Options: Trading futures and options on margin carries a high degree of risk and may result in losses exceeding your initial investment. These products are not suitable for all investors. Ensure you fully understand the risks and take appropriate care to manage your risk.
Patrick has been involved in the financial markets for well over a decade as a self-educated professional trader and money manager. Flitting between the roles of market commentator, analyst and mentor, Patrick has improved the technical skills and psychological stance of literally hundreds of traders – coaching them to become savvy market operators!